Academic project — February to June 2023 at ENSA Oujda. Goal: design and deploy a complete, functional SOC infrastructure capable of detecting real threats, correlating events across host and network layers, and managing incidents end to end.
Architecture
Six Ubuntu 20.04.4 LTS VMs (except Fleet on CentOS 8), all on VirtualBox 7.0.6 in bridged mode, on the same LAN. Each component runs isolated on its own VM to avoid interference and make the architecture easier to reason about.
VM1 — Wazuh v4.4.1 192.168.1.120 4GB RAM HIDS, agent management
VM2 — Elasticsearch + Kibana v7.17.10
192.168.1.106 8GB RAM Indexing, dashboards
VM3 — Logstash v7.17.10 192.168.1.203 2GB RAM Log ingestion pipeline
VM4 — Fleet server v4.33 192.168.1.45 4GB RAM Elastic Agent management (CentOS 8)
VM5 — Suricata v6.0.11 192.168.1.205 4GB RAM Network IDS/IPS
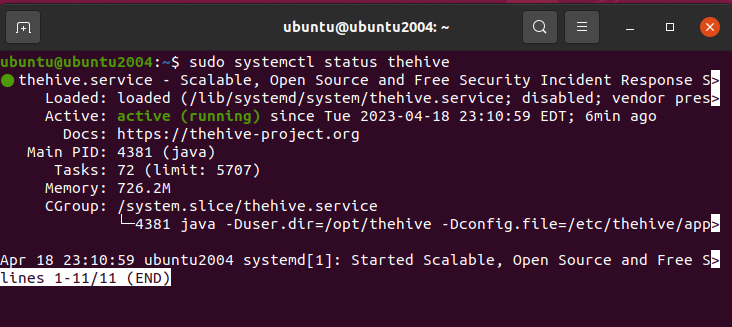
VM6 — MISP v2.4.170
TheHive v4.1.24-1
Cortex v3.1.7-1 192.168.1.204 4GB RAM Threat intel + incident management
All VMs run CLI-only. Web interfaces (Kibana, Wazuh dashboard, TheHive, MISP) are accessed from the physical host via browser.
Data flow
Endpoints (Elastic Agents)
        │
        ▼
Fleet Server ──────────────────► Elasticsearch
        │                              │
        │                              ▼
Logstash (pipeline)              Kibana dashboards
        │
        ▼
Suricata (network events) ──────► Elasticsearch

Wazuh Agents ──► Wazuh Server ──► Wazuh Indexer ──► Wazuh Dashboard
                                        │
                                        ▼
                               TheHive (cases) ◄──► MISP (IoCs) ◄──► Cortex (analysis)
Elastic Agent + Fleet handles data collection from endpoints without needing Logstash for most sources — Logstash is used for sources that require custom parsing pipelines.
Components
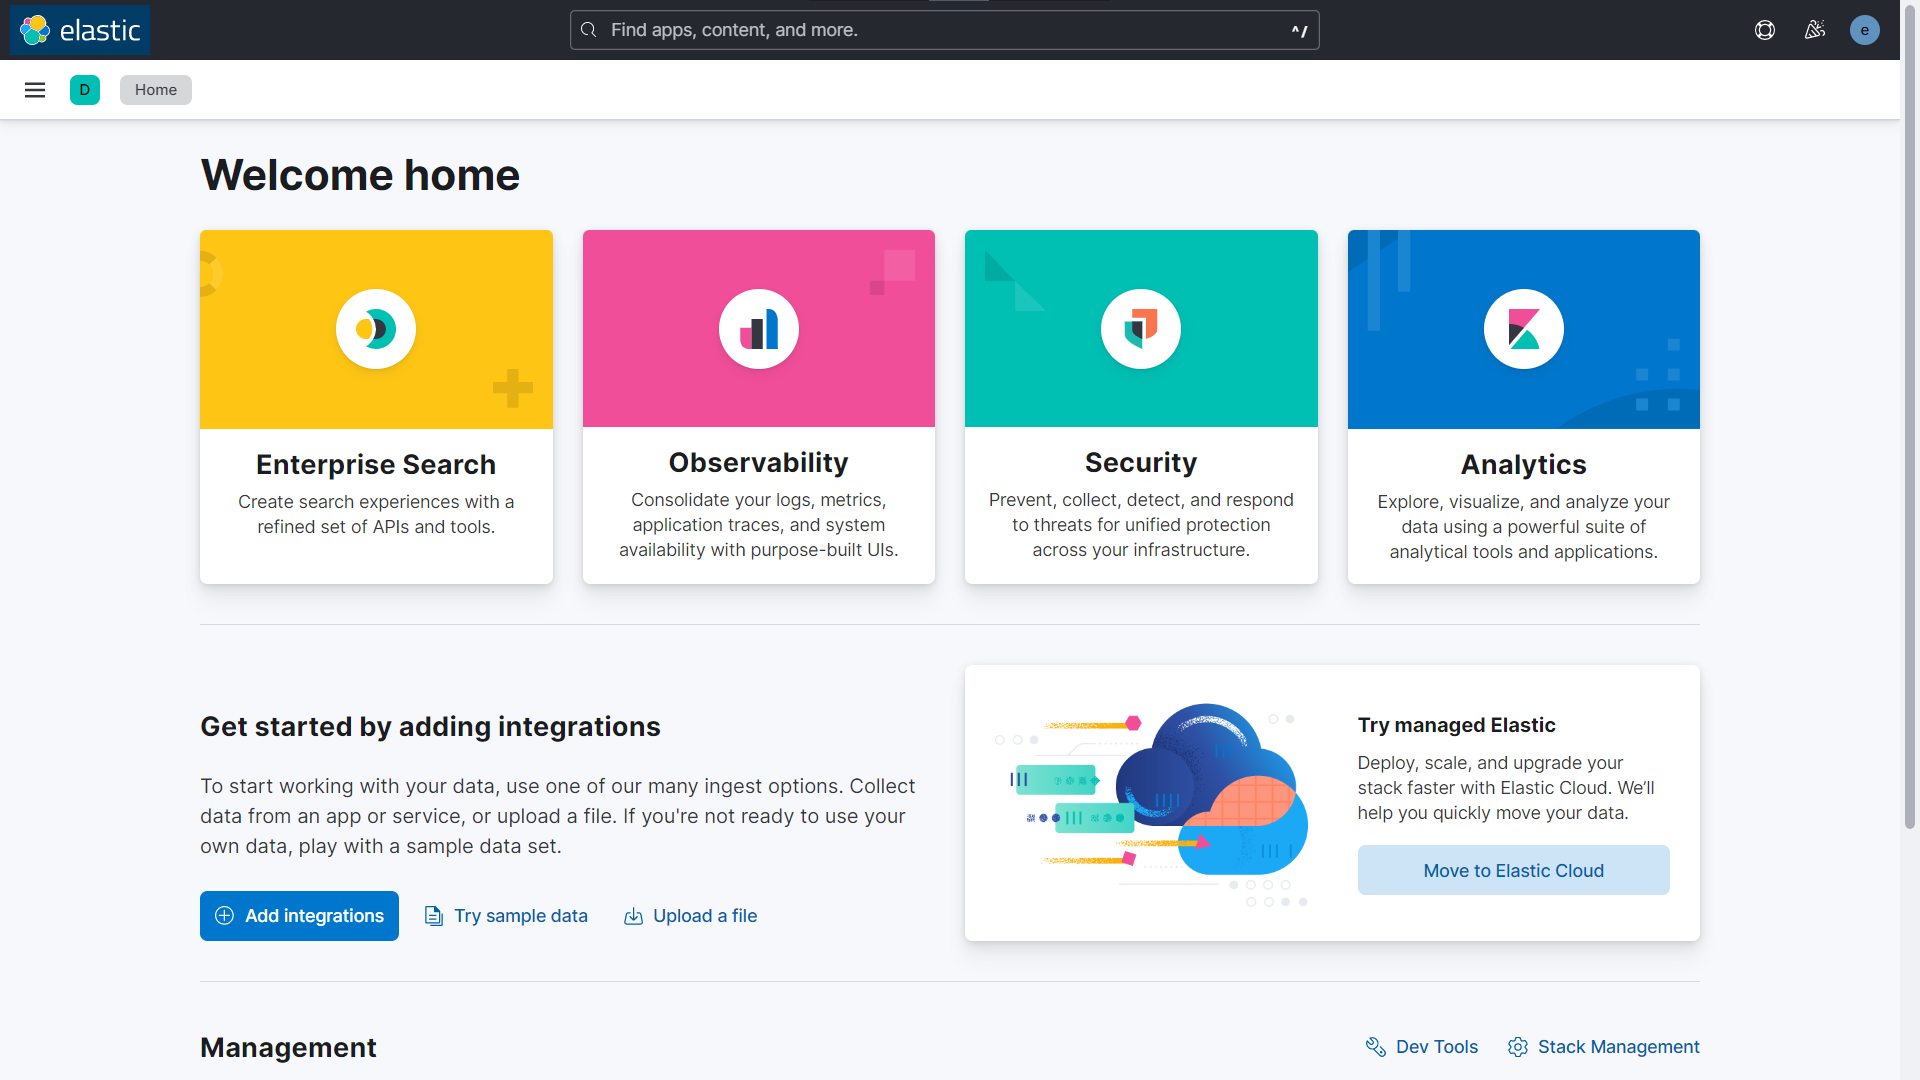
Elastic Stack
- Elasticsearch: indexes and stores all events as JSON documents, distributed across shards for resilience
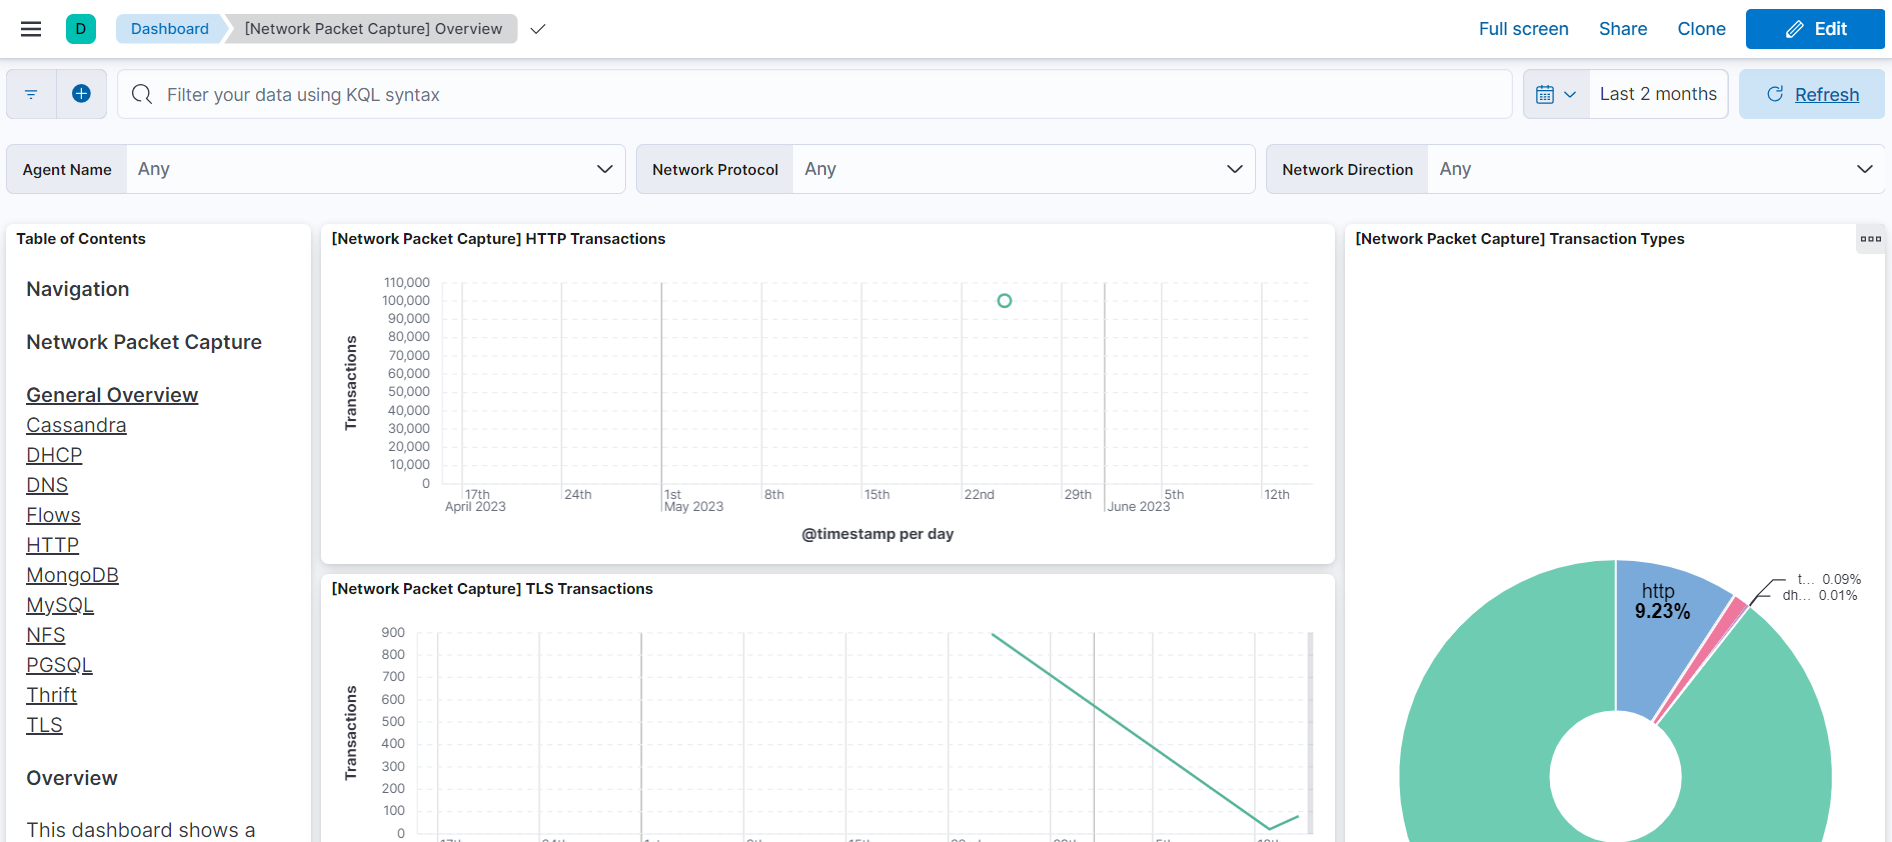
- Kibana: dashboards for system metrics (CPU, memory, disk per host), Suricata alerts with source/destination geo-mapping, Wazuh security events
- Logstash: ingestion pipeline with filtering, normalization and enrichment before indexing
- Elastic Agent + Fleet: centralized agent deployment and management — policies pushed from Fleet to agents on each monitored host
Wazuh
Three agents deployed: two Ubuntu hosts and one DVWA instance. Wazuh Server runs the analysis engine with MITRE ATT&CK rule enrichment and regulatory compliance mapping (PCI DSS, NIST 800-53).
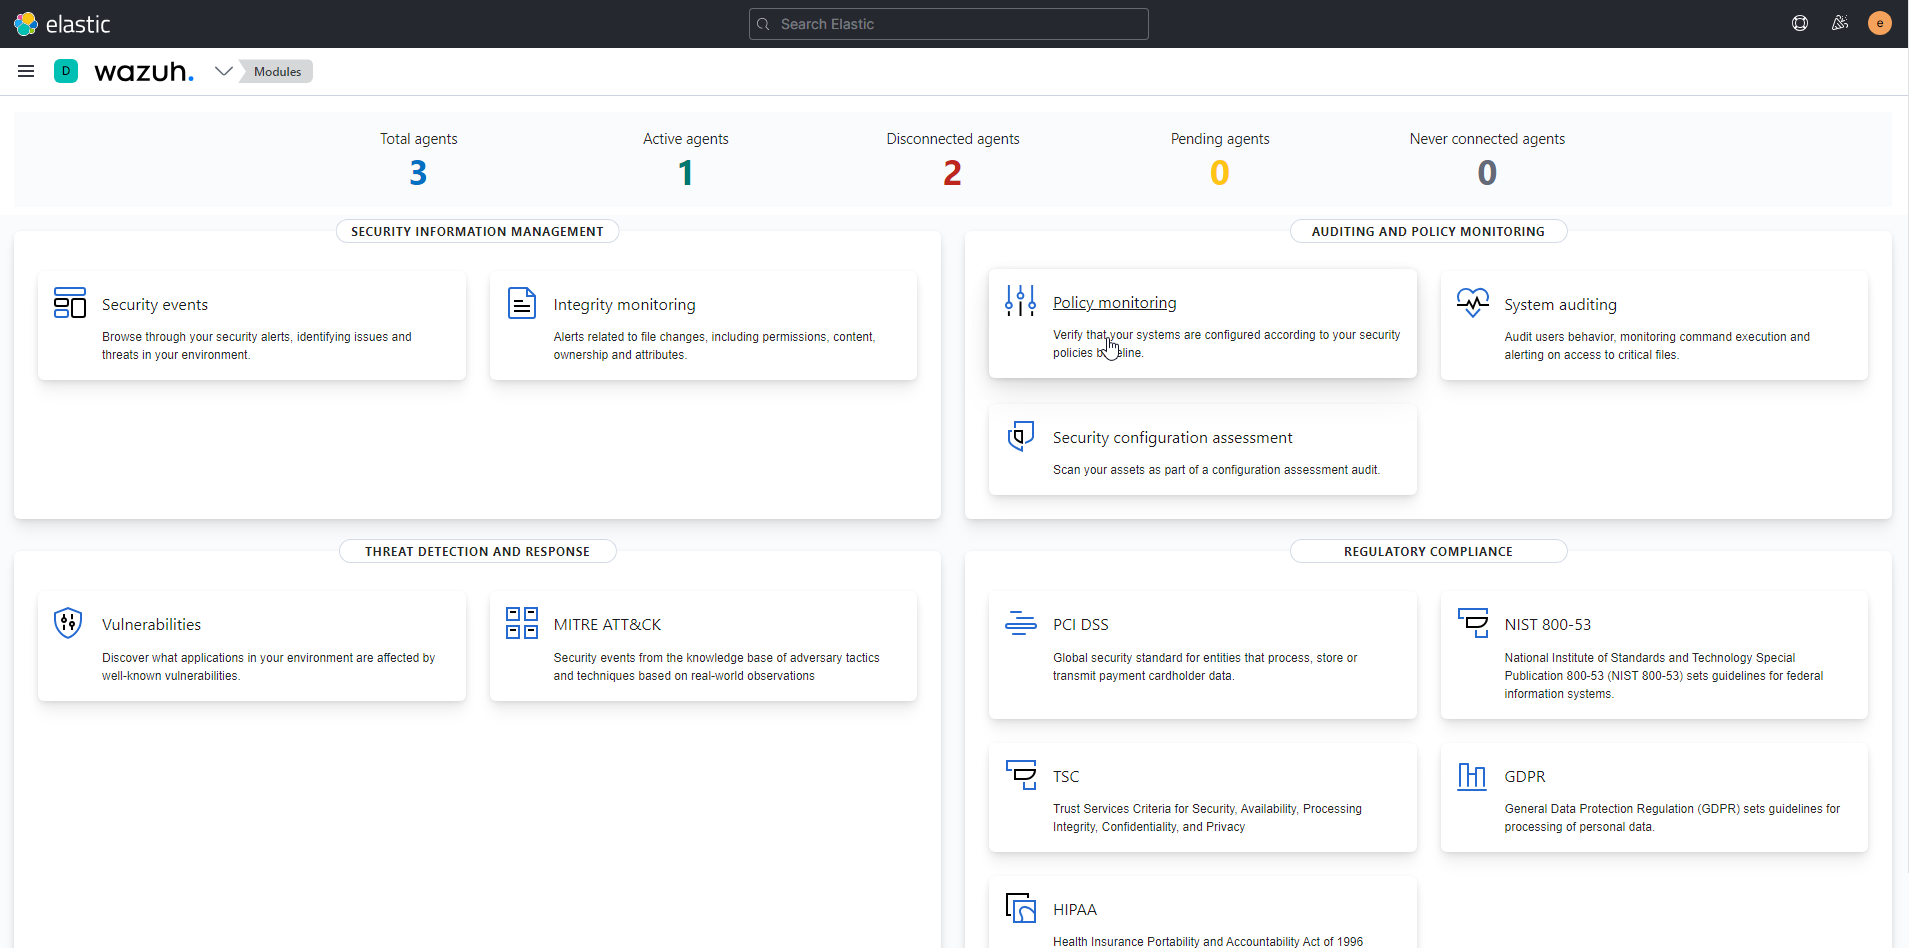
Detection categories configured: authentication events, file integrity monitoring, privilege escalation, system call auditing.
Suricata
Deployed in IDS/IPS mode on its own VM to monitor network traffic. Uses Emerging Threats ruleset. Tested with tmNIDS (testmynids.org) to inject simulated malicious traffic:
- HTTP malware user-agent strings
- Bad certificate authorities
- Tor .onion DNS queries
- EXE/DLL download over HTTP
- SSH outbound scan simulation
- Sinkhole DNS replies
- Known malware C2 patterns (Cryptowall, SuperFish)
Suricata alerts forwarded to Elasticsearch via Fleet integration, visible in Kibana with source/destination geo-map.
MISP + TheHive + Cortex
- MISP: IoC repository and threat intelligence sharing. Feeds enrichment data into the analysis chain.
- TheHive: case management for security incidents. Alerts escalated from Wazuh and Suricata create cases with observables.
- Cortex: automated analysis of observables (IPs, hashes, domains) via analyzers. Integrated with MISP for IoC correlation.
Validation
Tests structured at three levels:
Level 1 — Host metrics: Elastic Agents report CPU, memory and disk metrics to Elasticsearch. Verified via Kibana Metrics System dashboard.
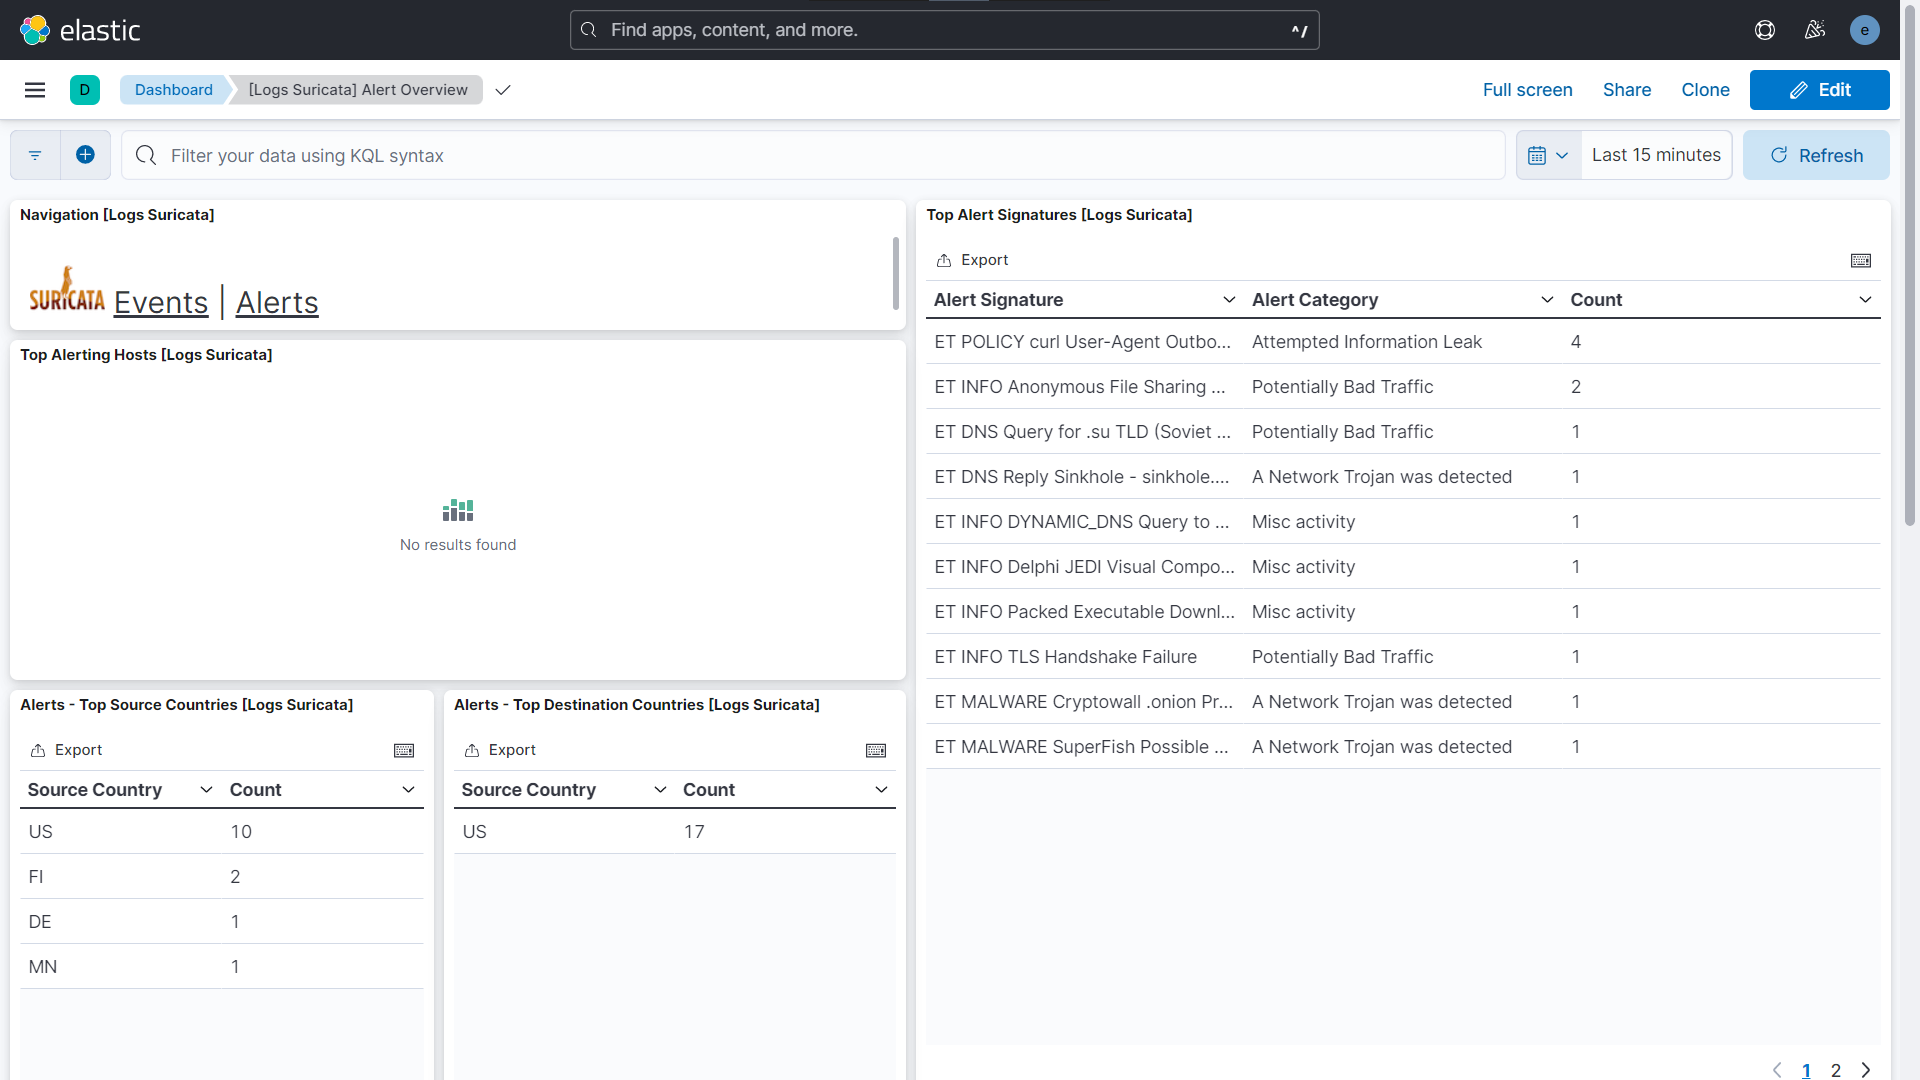
Level 2 — Network detection: tmNIDS script run on Suricata VM to generate malicious traffic patterns. Suricata fired alerts across all injected categories:
| Alert signature | Category |
|---|---|
| ET MALWARE Cryptowall .onion Proxy | Network Trojan detected |
| ET MALWARE SuperFish Possible | Network Trojan detected |
| ET DNS Reply Sinkhole | Network Trojan detected |
| ET POLICY malware User-Agent | Attempted Information Leak |
| ET INFO Anonymous File Sharing | Potentially Bad Traffic |
| ET DNS Query for .su TLD | Potentially Bad Traffic |
Level 3 — Host intrusion detection: Wazuh monitoring 3 agents including DVWA. After generating activity:
- 712 total security events detected
- 481 authentication failures
- 16 authentication successes
- Events tagged with MITRE ATT&CK TTPs: T1078 (Valid Accounts), T1548.003 (Sudo and Sudo Caching), T1100.001
Limitations
False positives: some legitimate traffic patterns (TLS handshake variations, internal DNS queries) triggered alerts. Tuning detection rules requires a baseline of normal traffic, which a lab environment doesn’t give you easily.
Resource constraints: 6 VMs at once put significant pressure on the host machines. Elasticsearch alone needs 8GB RAM to run comfortably. In practice this architecture belongs on cloud infrastructure or dedicated hardware.
What I learned
The integration chain from raw event to actionable alert is longer than it looks. Elasticsearch indexes fast and Kibana visualizes well, but the signal quality depends entirely on what you feed in and how you normalize it. Suricata fires on signatures — it’s reliable for known patterns but blind to what the rules don’t cover. Wazuh adds host context that network-only tools miss entirely.
MISP + TheHive + Cortex is the part that makes a SOC useful beyond detection: without structured case management and IoC enrichment, alerts stay alerts and never become investigations.